.svg)
Time Span Events
User Interface Example for Angular
Time span events are displayed in a panel that's separate from the time series chart associated with the events. The panel can be displayed or hidden by controls in the charting application's user interface, giving users control over whether to display the time span events.
In this tutorial
You will add a drop-down menu to the chart from the Hello World Example for Angular tutorial. The menu will open and close the time span events panel and selectively show and hide swim lanes of time span events.
Before you begin
This tutorial requires version 8.0.0 of the ChartIQ library.
The tutorial is a continuation of the Hello World Example for Angular tutorial. Please complete the Hello World example before proceeding.
Markup
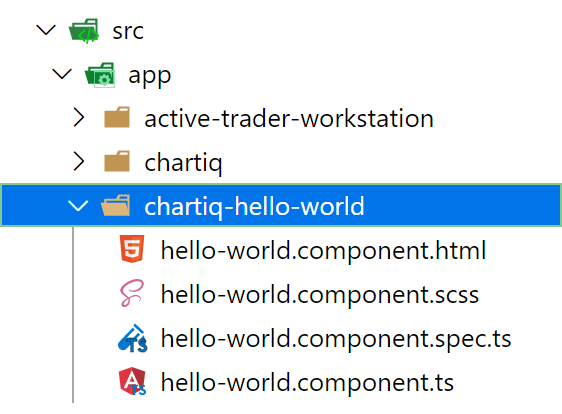
In your editor, open the src/app/chartiq-hello-world folder of your chartiq-angular-app project:
We'll begin by adding markup to the hello-world.component.html file to create a drop-down menu.
Add the following after the closing h2 heading tag in hello-world.component.html:
<button>Life Cycle Events</button>
<div id="menu">
    <div>
        <input type="checkbox"/>
        <label for="Filing">Filing</label>
    </div>
    <div>
        <input type="checkbox"/>
        <label for="Business">Business</label>
    </div>
    <div>
        <input type="checkbox"/>
        <label for="Order">Order</label>
    </div>
</div>
<button>
The button will show and hide the div that creates the menu.
We'll eventually add a click handler to give the button control of the menu.
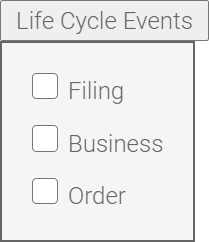
Notice the button text: Life Cycle Events. Time span events are also referred to as life cycle events. We'll use that name here just to help you get familiar with it.
<div id="menu">
The menu div contains three elements that create check boxes for user input. There's a check box for each of the types of time span events we created in the Hello World Example for Angular tutorial: "Filing", "Business", and "Order" (see the swim lane objects in the getTseData function in hello-world.component.ts).
We'll ultimately add click handlers to the check boxes so the event swim lanes can be displayed and hidden individually.
Styling
Let's add some style to our drop-down menu.
Add the following CSS rule-sets to hello-world.component.scss:
// Formats and positions the drop-down menu.
#menu {
    position: absolute;
    z-index: 2;
    background-color: #f5f5f5;
    padding: 10px;
    border: 1px solid;
}

// Spaces the drop-down menu elements.
#menu div {
    padding: 5px;
}

// Formats the drop-down menu input elements.
#menu div input {
    font-size: 0.80rem;
    margin-right: 5px;
    cursor: pointer;
}

// Hides the drop-down menu.
.closed {
    display: none;
}
The first three rule-sets style and position the menu. The last rule-set, .closed, is used to show and hide the menu.
We'll add a conditional class to the menu div to add or remove the closed class. Ultimately, a variable controlled by a click handler on the Life Cycle Events button will provide the condition that adds or removes the class, thereby closing or opening the menu. For now, we'll just set the condition to true.
Add the conditional class to the menu div in hello-world.component.html as follows:
<div id="menu" [ngClass]="{'closed': true}">
    .
    .
    .
Handlers
Now we'll create the click handlers that show and hide the drop-down menu and the time span event swim lanes.
menuOpen = !menuOpen
The click handler that opens and closes the drop-down menu is a single statement that we'll add to the button element in hello-world.component.html:
<button (click)="menuOpen = !menuOpen">Life Cycle Events</button>
The statement toggles the value of the menuOpen variable from true to false or false to true with each click of the button. Initially (before any button clicks), the variable is undefined and therefore false.
Now we can add the variable to the conditional class of the menu div to alternately add or remove the closed class when the button is clicked.
The completed button and menu should look like this:
<button (click)="menuOpen = !menuOpen">Life Cycle Events</button>
<div id="menu" [ngClass]="{'closed': !menuOpen}">
    .
    .
    .
Run it!
Let's try out our new menu.
Start the application by entering the following command in the root directory of your chartiq-angular-app project:
npm start
Load the following in your web browser:
http://localhost:4200/hello-world
Select the Life Cycle Events button; the menu should open. Select the button again; the menu should close.
You should also be able to select and clear the check boxes, although they don't do anything yet. We'll take care of that next.
showMarkers
The showMarkers handler shows and hides time span event swim lanes.
But before we create the handler, we need to make some adjustments to the code in hello-world.component.ts, some of which we created in the Hello World Example for Angular tutorial.
stx property
We're going to need to reference the chart engine in the showMarkers handler, so let's create a class property that can hold a chart engine reference.
Add the following property declaration to the HelloWorldComponent class:
private stx: CIQ.ChartEngine;
ngAfterViewInit method
In the ngAfterViewInit method of HelloWorldComponent, remove the following statements:
stx.timeSpanEventPanel.showTimeSpanEvent(this.getTseData("Filing"));
stx.timeSpanEventPanel.showTimeSpanEvent(this.getTseData("Business"));
stx.timeSpanEventPanel.showTimeSpanEvent(this.getTseData("Order"));
If you're watching the application in a web browser, the Time Span Events panel should have disappeared.
Next, replace all remaining references to stx in the function scope with this.stx (the stx property).
Note: Don't change the references in the event listener scope.
Here's the revised method:
ngAfterViewInit() {
    const container = this.chartContainer.nativeElement;

    this.stx = new CIQ.ChartEngine({ container });

    new CIQ.TimeSpanEventPanel({
        stx: this.stx,
        showTooltip: true,
        infoPanel: {
            spanEvent: "main",
            durationEvent: "main",
            singleEvent: "main"
        }
    });

    this.stx.loadChart('SPY', {
        masterData: this.getMasterData(),
        periodicity: {
            period: 1,
            interval: 5,
            timeUnit: 'minute',
        },
    });

    this.stx.addEventListener("layout", ({ stx }) => {
        if (!stx.panels.timeSpanEventPanel) {
            stx.remove("draw");
            stx.timeSpanEventPanel.removeTimeSpanEvent("Filing");
            stx.timeSpanEventPanel.removeTimeSpanEvent("Business");
            stx.timeSpanEventPanel.removeTimeSpanEvent("Order");
        }
    });

}
We're still creating the instance of the time span events panel in ngAfterviewInit to make the panel an integral part of the chart. The instantiation does not make the panel appear on screen; showMarkers will do that.
Method definition
Now, we're ready to create the click handler.
Add the following method to the HelloWorldComponent class:
showMarkers(eventType) {
    let checkbox = <HTMLInputElement>event.target;
    if (checkbox.checked) {
        this.stx.timeSpanEventPanel.showTimeSpanEvent(this.getTseData(eventType));
    } else {
        this.stx.timeSpanEventPanel.removeTimeSpanEvent(eventType);
    }
}
The handler will be attached to the check boxes in the drop-down menu. Each check box will provide a unique eventType argument which specifies a type of time span event, such as "Filing", "Business", or "Order".
The showMarkers method uses the event target to get a reference to the check box that invoked the handler. If the check box has been selected, the method displays the swim lane of time span events specified by eventType. If the check box has been cleared, the method removes the swim lane specified by eventType. The argument for removeTimeSpanEvent is just the event type; no other event data is needed.
The Time Span Events plug-in takes care of opening and closing the time span events panel. For example, when the first swim lane is added, the panel automatically opens; when the last swim lane is removed, the panel closes.
Now we need to set the method as a click handler on the input tags that represent the drop-down menu check boxes.
Add the click handler to hello-world.component.html as follows:
<div>
    <input type="checkbox" (click)="showMarkers('Filing')"/>
    <label for="Filing">Filing</label>
</div>
<div>
    <input type="checkbox" (click)="showMarkers('Business')"/>
    <label for="Business">Business</label>
</div>
<div>
    <input type="checkbox" (click)="showMarkers('Order')"/>
    <label for="Order">Order</label>
</div>
Note: The showMarkers argument must match the type property of a swim lane data object in the getTseData method in hello-world.component.ts. The argument should also correspond to the label of the input element.
Close the panel
Now that we can show and hide swim lanes individually using the Life Cycle Events menu, our layout event listener needs an upgrade; it can't remove all three swim lanes all the time. (If you've tried the menu at this point, you should have gotten an error in your development console when the time span events panel closed.)
The listener has to determine that a swim lane exists, then remove it. To do that, the listener is going to have to query the DOM to see which menu check boxes are selected (or checked).
Add template reference variables
We'll enable the DOM query by adding template reference variables to each of the HTML input elements.
Revise the markup for the three check boxes in hello-world.component.html as follows:
<input #checkbox type="checkbox" (click)="showMarkers('Filing')"/>

<input #checkbox type="checkbox" (click)="showMarkers('Business')"/>

<input #checkbox type="checkbox" (click)="showMarkers('Order')"/>
Import ViewChildren and QueryList
We'll query the check boxes as a group.
Add the ViewChildren decorator function and QueryList class to the import statement at the top of hello-world.component.ts as follows:
import { Component, ViewChild, ViewChildren, QueryList, ElementRef, AfterViewInit, ViewEncapsulation } from '@angular/core';
Create the query
Now we can define the DOM query.
Add the following to the HelloWorldComponent class in hello-world.component.ts after the chartContainer query:
@ViewChildren('checkbox') checkboxes: QueryList<ElementRef>;
Revise the event listener
Finally, update the layout event listener function as follows:
this.stx.addEventListener("layout", ({ stx }) => {
    if (!stx.panels.timeSpanEventPanel) {
        stx.remove("draw");
        this.checkboxes.forEach(checkbox => {
            if (checkbox.nativeElement.checked) checkbox.nativeElement.click();
        });
    }
});
Now, the callback function iterates through the queried list of check boxes and determines one by one whether they're checked. If a check box is checked, the swim lane for that check box is removed by calling the check box click handler, showMarkers.
The completed files
Here are the completed source files.
hello-world.component.html
<div style="margin: 20px;">
<h2>
    Hello world static chart example
</h2>
<button (click)="menuOpen = !menuOpen">Life Cycle Events</button>
<div id="menu" [ngClass]="{'closed': !menuOpen}">
    <div>
        <input #checkbox type="checkbox" (click)="showMarkers('Filing')"/>
        <label for="Filing">Filing</label>
    </div>
    <div>
        <input #checkbox type="checkbox" (click)="showMarkers('Business')"/>
        <label for="Business">Business</label>
    </div>
    <div>
        <input #checkbox type="checkbox" (click)="showMarkers('Order')"/>
        <label for="Order">Order</label>
    </div>
</div>
<div
    #chartContainer
    class="chartContainer"
    style="
        width: 800px;
        height: 460px;
        position: relative;
        border: solid 1px #aaa
    "></div>
</div>
hello-world.component.scss
@import '~chartiq/css/stx-chart.css'; // Chart API
@import "~chartiq/css/chartiq.css";
@import "~chartiq/examples/markers/tradeAnalyticsSample.css";

// Formats and positions the drop-down menu.
#menu {
    position: absolute;
    z-index: 2;
    background-color: #f5f5f5;
    padding: 10px;
    border: 1px solid;
}

// Spaces the drop-down menu elements.
#menu div {
    padding: 5px;
}

// Formats the drop-down menu input elements.
#menu div input {
    font-size: 0.80rem;
    margin-right: 5px;
    cursor: pointer;
}

// Hides the drop-down menu.
.closed {
    display: none;
}

// Customize the sub-event markers and pop-up displays.

// Sub-event marker pop-up displays.
.stx-performance-marker.stx-marker-expand {
    background: rgba(255, 255, 255, 0.90);
    max-width: 200px;
    max-height: 200px;
    padding: 10px;
    opacity: 1;
    color: #000;
    display: block;
    border: 1px solid rgba(180, 180, 180, 0.90);
    overflow: auto;
    position: absolute;
}

// Pop-up display heading text.
.stx-performance-marker.stx-marker-expand h4 {
    display: block;
    font-size: 0.80rem;
}

// Pop-up display body text.
.stx-performance-marker.stx-marker-expand p {
    font-variant: small-caps;
}

// Sub-event markers.
.stx-marker.trade .stx-visual {
    background: #C950d7;
    width: 8px;
    height: 8px;
}
hello-world.component.ts
import { Component, ViewChild, ViewChildren, QueryList, ElementRef, AfterViewInit, ViewEncapsulation } from '@angular/core';

import { CIQ } from 'chartiq/js/chartiq';
import "chartiq/js/advanced";
import "chartiq/plugins/timespanevent/timespanevent";

/**
 * The Hello World component creates a basic chart from a built-in static data source. The chart
 * does not have a user interface.
 */
@Component({
    selector: 'cq-hello-world',
    templateUrl: './hello-world.component.html',
    styleUrls: ['./hello-world.component.scss'],
    encapsulation: ViewEncapsulation.None
})
export class HelloWorldComponent implements AfterViewInit {
    @ViewChild('chartContainer', { static: true }) chartContainer: ElementRef;
    @ViewChildren('checkbox') checkboxes: QueryList<ElementRef>;

    private stx: CIQ.ChartEngine;

    constructor() {}

    ngAfterViewInit() {
        const container = this.chartContainer.nativeElement;

        this.stx = new CIQ.ChartEngine({ container });

        new CIQ.TimeSpanEventPanel({
            stx: this.stx,
            showTooltip: true,
            infoPanel: {
                spanEvent: "main",
                durationEvent: "main",
                singleEvent: "main"
            }
        });

        this.stx.loadChart('SPY', {
            masterData: this.getMasterData(),
            periodicity: {
                period: 1,
                interval: 5,
                timeUnit: 'minute',
            },
        });

        this.stx.addEventListener("layout", ({ stx }) => {
            if (!stx.panels.timeSpanEventPanel) {
                stx.remove("draw");
                this.checkboxes.forEach(checkbox => {
                    if (checkbox.nativeElement.checked) checkbox.nativeElement.click();
                });
            }
        });

    }

    /**
     * Shows and hides time span event swim lanes.
     *
     * @param eventType Specifies the type of time span events to be shown or hidden. Must match
     *      the `type` property of a swim lane data object.
     */
    showMarkers(eventType) {
        let checkbox = <HTMLInputElement>event.target;
        if (checkbox.checked) {
            this.stx.timeSpanEventPanel.showTimeSpanEvent(this.getTseData(eventType));
        } else {
            this.stx.timeSpanEventPanel.removeTimeSpanEvent(eventType);
        }
    }

    /**
     * Gets the data for a swim lane of time span events.
     *
     * @param eventType Specifies the type of time span event. Must match the `type` property of
     *      a swim lane data object.
     * @return A swim lane data object, which contains an array of time span events.
     */
    getTseData(eventType) {

        // Span events.
        const businessEvents = [
            {
                label: "Business",
                spanLabel: "Product Demo",
                startDate: "2020-04-01T09:30:00",
                endDate: "2020-04-01T11:00:00",
                bgColor: "#00f",
                headline: "New Product",
                story: "Presentation to media."
            },
            {
                label: "Business",
                spanLabel: "Board Meeting",
                startDate: "2020-04-01T12:00:00",
                endDate: "2020-04-01T16:00:00",
                bgColor: "#f90",
                textColor: "#000"
            },
        ];

        // Single events.
        const filingEvents = [
            {
                label: "Filing",
                startDate: "2020-04-01T11:30",
                markerShape: "square",
                bgColor: "#a09",
                headline: "SEC Filing",
                story: "10K"
            },
            {
                label: "Filing",
                startDate: "2020-04-01T14:35:00",
                markerShape: "square",
                bgColor: "#0a0",
                headline: "SEC Filing",
                story: "10Q"
            }
        ];

        // Duration events.
        const orderEvents = [
            {
                label: "Order",
                startDate: "2020-04-01T10:00",
                endDate: "2020-04-01T11:45",
                markerShape: "circle",
                category: "trade",
                subChildren: [
                    {
                        date: new Date("2020-04-01T10:10:00"),
                        price: 156.46,
                        headline: "Trade Execution",
                        story: "Price: 156.46"
                    },
                    {
                        date: new Date("2020-04-01T10:40:00"),
                        price: 156.50,
                        headline: "Trade Execution",
                        story: "Price: 156.50"
                    },
                    {
                        date: new Date("2020-04-01T11:20:00"),
                        price: 156.43,
                        headline: "Trade Execution",
                        story: "Price: 156.43"
                    },
                    {
                        date: new Date("2020-04-01T11:45:00"),
                        price: 156.54,
                        headline: "Trade Execution",
                        story: "Price: 156.54"
                    }
                ],
                headline: "Trade Start",
                story: new Date("2020-04-01T10:00"),
                bgColor: "#aa0"
            },
            {
                label: "Order",
                startDate: "2020-04-01T13:00",
                endDate: "2020-04-01T15:25",
                markerShape: "circle",
                category: "trade",
                subChildren: [
                    {
                        date: new Date("2020-04-01T13:50:00"),
                        price: 156.55,
                        headline: "Trade Execution",
                        story: "Price: 156.55"
                    },
                    {
                        date: new Date("2020-04-01T14:25:00"),
                        price: 156.45,
                        headline: "Trade Execution",
                        story: "Price: 156.45"
                    },
                    {
                        date: new Date("2020-04-01T15:25:00"),
                        price: 156.54,
                        headline: "Trade Execution",
                        story: "Price: 156.54"
                    }
                ],
                headline: "Trade Start",
                story: new Date("2020-04-01T10:40"),
                bgColor: "#0af",
                isActive: true
            }
        ];

        // Swim lane objects.

        const business = {
            type: "Business",
            events: businessEvents,
            spanType: "spanEvent"
        }

        const filing = {
            type: "Filing",
            events: filingEvents,
            spanType: "singleEvent"
        }

        const order = {
            type: "Order",
            events: orderEvents,
            spanType: "durationEvent"
        }

        switch (eventType.toLowerCase()) {
            case "business":
                return business;
            case "filing":
                return filing;
            case "order":
                return order;
        }

    }

    getMasterData() {
        const masterData = [
            {Date:"20200331144000000",Open:156.64,High:156.66,Low:156.57,Close:156.59,Volume:932912},
            {Date:"20200331145000000",Open:156.58,High:156.62,Low:156.57,Close:156.61,Volume:700952},
            {Date:"20200331145500000",Open:156.59,High:156.60,Low:156.55,Close:156.58,Volume:1084428},
            {Date:"20200331150000000",Open:156.57,High:156.58,Low:156.53,Close:156.55,Volume:916684},
            {Date:"20200331150500000",Open:156.54,High:156.57,Low:156.52,Close:156.55,Volume:1360390},
            {Date:"20200331151000000",Open:156.56,High:156.60,Low:156.54,Close:156.58,Volume:2037170},
            {Date:"20200331151500000",Open:156.55,High:156.62,Low:156.54,Close:156.60,Volume:4280833},
            {Date:"20200331152000000",Open:156.61,High:156.62,Low:156.54,Close:156.57,Volume:3348274},
            {Date:"20200331152500000",Open:156.59,High:156.62,Low:156.52,Close:156.54,Volume:932912},
            {Date:"20200331153000000",Open:156.56,High:156.57,Low:156.50,Close:156.52,Volume:700952},
            {Date:"20200331153500000",Open:156.51,High:156.56,Low:156.50,Close:156.54,Volume:1084428},
            {Date:"20200331154000000",Open:156.52,High:156.56,Low:156.51,Close:156.55,Volume:916684},
            {Date:"20200331154500000",Open:156.56,High:156.57,Low:156.50,Close:156.53,Volume:1360390},
            {Date:"20200331155000000",Open:156.52,High:156.53,Low:156.49,Close:156.50,Volume:2037170},
            {Date:"20200331155500000",Open:156.51,High:156.52,Low:156.46,Close:156.48,Volume:4280833},
            {Date:"20200331160000000",Open:156.49,High:156.48,Low:156.44,Close:156.47,Volume:3348274},
            {Date:"20200401093000000",Open:156.41,High:156.48,Low:156.39,Close:156.46,Volume:1869466},
            {Date:"20200401093500000",Open:156.44,High:156.53,Low:156.40,Close:156.49,Volume:2937883},
            {Date:"20200401094000000",Open:156.48,High:156.54,Low:156.37,Close:156.43,Volume:2277682},
            {Date:"20200401094500000",Open:156.47,High:156.55,Low:156.45,Close:156.51,Volume:1714687},
            {Date:"20200401095000000",Open:156.49,High:156.58,Low:156.48,Close:156.54,Volume:1902583},
            {Date:"20200401095500000",Open:156.54,High:156.59,Low:156.50,Close:156.56,Volume:1325148},
            {Date:"20200401100000000",Open:156.56,High:156.60,Low:156.50,Close:156.53,Volume:2005588},
            {Date:"20200401100500000",Open:156.52,High:156.54,Low:156.42,Close:156.43,Volume:1277880},
            {Date:"20200401101000000",Open:156.44,High:156.46,Low:156.36,Close:156.37,Volume:1158301},
            {Date:"20200401101500000",Open:156.38,High:156.39,Low:156.26,Close:156.28,Volume:1987415},
            {Date:"20200401102000000",Open:156.26,High:156.33,Low:156.22,Close:156.32,Volume:1512742},
            {Date:"20200401102500000",Open:156.31,High:156.40,Low:156.31,Close:156.39,Volume:871592},
            {Date:"20200401103000000",Open:156.38,High:156.43,Low:156.35,Close:156.40,Volume:1132109},
            {Date:"20200401103500000",Open:156.40,High:156.44,Low:156.37,Close:156.41,Volume:725521},
            {Date:"20200401104000000",Open:156.41,High:156.50,Low:156.41,Close:156.48,Volume:704072},
            {Date:"20200401104500000",Open:156.48,High:156.50,Low:156.42,Close:156.46,Volume:844084},
            {Date:"20200401105000000",Open:156.47,High:156.47,Low:156.42,Close:156.45,Volume:392122},
            {Date:"20200401105500000",Open:156.45,High:156.47,Low:156.38,Close:156.41,Volume:544729},
            {Date:"20200401110000000",Open:156.43,High:156.47,Low:156.41,Close:156.44,Volume:660383},
            {Date:"20200401110500000",Open:156.43,High:156.47,Low:156.40,Close:156.41,Volume:640177},
            {Date:"20200401111000000",Open:156.41,High:156.44,Low:156.35,Close:156.39,Volume:845668},
            {Date:"20200401111500000",Open:156.38,High:156.41,Low:156.37,Close:156.39,Volume:503347},
            {Date:"20200401112000000",Open:156.39,High:156.43,Low:156.38,Close:156.41,Volume:360929},
            {Date:"20200401112500000",Open:156.40,High:156.42,Low:156.37,Close:156.38,Volume:749554},
            {Date:"20200401113000000",Open:156.39,High:156.44,Low:156.38,Close:156.42,Volume:723857},
            {Date:"20200401113500000",Open:156.40,High:156.45,Low:156.40,Close:156.44,Volume:455561},
            {Date:"20200401114000000",Open:156.43,High:156.48,Low:156.42,Close:156.45,Volume:670704},
            {Date:"20200401114500000",Open:156.44,High:156.54,Low:156.44,Close:156.50,Volume:827725},
            {Date:"20200401115000000",Open:156.51,High:156.55,Low:156.48,Close:156.53,Volume:828780},
            {Date:"20200401115500000",Open:156.53,High:156.55,Low:156.48,Close:156.49,Volume:687357},
            {Date:"20200401120000000",Open:156.48,High:156.52,Low:156.48,Close:156.51,Volume:343617},
            {Date:"20200401120500000",Open:156.50,High:156.58,Low:156.50,Close:156.57,Volume:444181},
            {Date:"20200401121000000",Open:156.57,High:156.61,Low:156.56,Close:156.57,Volume:932850},
            {Date:"20200401121500000",Open:156.58,High:156.63,Low:156.56,Close:156.61,Volume:622879},
            {Date:"20200401122000000",Open:156.61,High:156.64,Low:156.54,Close:156.56,Volume:417197},
            {Date:"20200401122500000",Open:156.57,High:156.60,Low:156.54,Close:156.56,Volume:524792},
            {Date:"20200401123000000",Open:156.57,High:156.63,Low:156.56,Close:156.63,Volume:547832},
            {Date:"20200401123500000",Open:156.63,High:156.69,Low:156.62,Close:156.65,Volume:1033940},
            {Date:"20200401124000000",Open:156.65,High:156.66,Low:156.59,Close:156.60,Volume:666020},
            {Date:"20200401124500000",Open:156.60,High:156.63,Low:156.52,Close:156.54,Volume:886571},
            {Date:"20200401125000000",Open:156.54,High:156.59,Low:156.53,Close:156.57,Volume:409824},
            {Date:"20200401125500000",Open:156.57,High:156.57,Low:156.52,Close:156.53,Volume:490971},
            {Date:"20200401130000000",Open:156.53,High:156.62,Low:156.53,Close:156.62,Volume:618202},
            {Date:"20200401130500000",Open:156.62,High:156.63,Low:156.56,Close:156.56,Volume:232977},
            {Date:"20200401131000000",Open:156.56,High:156.58,Low:156.52,Close:156.52,Volume:569834},
            {Date:"20200401131500000",Open:156.53,High:156.55,Low:156.50,Close:156.54,Volume:526717},
            {Date:"20200401132000000",Open:156.54,High:156.54,Low:156.48,Close:156.52,Volume:587983},
            {Date:"20200401132500000",Open:156.52,High:156.52,Low:156.46,Close:156.46,Volume:683988},
            {Date:"20200401133000000",Open:156.46,High:156.48,Low:156.44,Close:156.44,Volume:505235},
            {Date:"20200401133500000",Open:156.45,High:156.46,Low:156.41,Close:156.44,Volume:760274},
            {Date:"20200401134000000",Open:156.45,High:156.45,Low:156.41,Close:156.42,Volume:428196},
            {Date:"20200401134500000",Open:156.43,High:156.49,Low:156.42,Close:156.49,Volume:372145},
            {Date:"20200401135000000",Open:156.49,High:156.55,Low:156.42,Close:156.42,Volume:493463},
            {Date:"20200401135500000",Open:156.42,High:156.46,Low:156.37,Close:156.38,Volume:763911},
            {Date:"20200401140000000",Open:156.38,High:156.44,Low:156.38,Close:156.43,Volume:478714},
            {Date:"20200401140500000",Open:156.43,High:156.48,Low:156.40,Close:156.47,Volume:347221},
            {Date:"20200401141000000",Open:156.46,High:156.48,Low:156.44,Close:156.45,Volume:527388},
            {Date:"20200401141500000",Open:156.46,High:156.47,Low:156.39,Close:156.46,Volume:1254489},
            {Date:"20200401142000000",Open:156.47,High:156.52,Low:156.43,Close:156.50,Volume:588877},
            {Date:"20200401142500000",Open:156.49,High:156.50,Low:156.45,Close:156.46,Volume:391738},
            {Date:"20200401143000000",Open:156.46,High:156.50,Low:156.43,Close:156.46,Volume:835468},
            {Date:"20200401143500000",Open:156.46,High:156.51,Low:156.45,Close:156.48,Volume:465308},
            {Date:"20200401144000000",Open:156.48,High:156.50,Low:156.47,Close:156.49,Volume:389872},
            {Date:"20200401144500000",Open:156.48,High:156.53,Low:156.48,Close:156.50,Volume:530820},
            {Date:"20200401145000000",Open:156.50,High:156.53,Low:156.48,Close:156.53,Volume:554269},
            {Date:"20200401145500000",Open:156.53,High:156.57,Low:156.52,Close:156.56,Volume:622473},
            {Date:"20200401150000000",Open:156.57,High:156.59,Low:156.53,Close:156.59,Volume:593592},
            {Date:"20200401150500000",Open:156.59,High:156.61,Low:156.56,Close:156.58,Volume:1089712},
            {Date:"20200401151000000",Open:156.59,High:156.59,Low:156.55,Close:156.57,Volume:634702},
            {Date:"20200401151500000",Open:156.57,High:156.64,Low:156.57,Close:156.60,Volume:1206417},
            {Date:"20200401152000000",Open:156.60,High:156.61,Low:156.58,Close:156.60,Volume:641636},
            {Date:"20200401152500000",Open:156.59,High:156.60,Low:156.54,Close:156.55,Volume:873698},
            {Date:"20200401153000000",Open:156.55,High:156.64,Low:156.55,Close:156.59,Volume:1318720},
            {Date:"20200401153500000",Open:156.60,High:156.68,Low:156.59,Close:156.68,Volume:1520610},
            {Date:"20200401154000000",Open:156.68,High:156.74,Low:156.67,Close:156.74,Volume:1678678},
            {Date:"20200401154500000",Open:156.74,High:156.80,Low:156.73,Close:156.76,Volume:2854531},
            {Date:"20200401155000000",Open:156.75,High:156.79,Low:156.71,Close:156.72,Volume:2984534},
            {Date:"20200401155500000",Open:156.71,High:156.75,Low:156.63,Close:156.73,Volume:7105595},
            {Date:"20200401160000000",Open:156.73,High:156.78,Low:156.71,Close:156.77,Volume:3863507}
        ];
        return masterData;
    }
}
Run it!
Start the project with npm start.
Load http://localhost:4200/hello-world in your web browser.
You should be able to use the Life Cycle Events drop-down menu to make time span events appear and disappear in the time span events panel.
 Figure. Chart with drop-down menu and time span events.
Notice how the panel closes when you clear all the check boxes, and how it opens when you subsequently select a check box. Also, take note of how the panel dynamically resizes based on the number of swim lanes.
Conclusion
You now know how to control the time span events panel and its contents from the user interface of your charting applications. All that remains is to obtain real data.
See the Time Span Events User Interface Example tutorial for a demonstration of connecting time span events to a real-time data source.
Contact us at support@chartiq.com if you have any questions about the Time Span Events plug-in.
Next steps
Explore the API documentation: